NH3 molecule
Calculation Data
| name of submitted log file |
Olidavies_nh3_optf.log
|
| molecule |
NH3
|
| method |
RB3LYP
|
| basis set |
6-31G(d,p)
|
| final energy |
-56.557769 Hartree
|
| RMS gradient |
0.000000
|
| point group |
C3v
|
Item Table
| Item |
Value |
Threshold |
Converged?
|
| Maximum Force |
0.000000 |
0.000015 |
Yes
|
| RMS Force |
0.000000 |
0.000010 |
Yes
|
| Maximum Displacement |
0.000003 |
0.000060 |
Yes
|
| RMS Displacement |
0.000001 |
0.000040 |
Yes
|
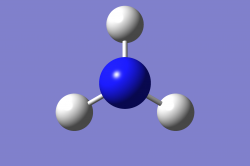
Optimised Molecule Image
Jmol Rotatable Molecule
logfile: Media:OLIDAVIES_NH3_OPTF_POP.LOG
Optimised NH3 Molecule
Important Geometric Parameters
Optimised bond distance and angle for NH3
r(N-H)= 1.018Â
θ(H-N-H)=106°
Low Frequencies (cm⁻¹)
 Low frequencies ---   -5.6864   -3.6131   -3.6124    0.0017    0.0048    0.0162
 Low frequencies --- 1089.3674 1693.9284 1693.9284
Wavenumber, Symmetry, Intensity Table
| Number |
Vibration (cm⁻¹) |
Symmetry |
Intensities (km/mol)
|
| 1 |
1089 |
A1 |
145
|
| 2 |
1694 |
E |
14
|
| 3 |
1694 |
E |
14
|
| 4 |
3461 |
A1 |
1
|
| 5 |
3590 |
E |
0
|
| 6 |
3590 |
E |
0
|
IR Spectrum

Atomic Charge

The angle of the image isnt great but the back left hydrogen also has the same charge as the visible two, visualised as 0.375e and reported as 0.38e
Atomic charge colour range:

| Atomic charge table
|
| Atom |
Atomic charge (e)
|
| Nitrogen |
-1.13
|
| Hydrogen |
0.38
|
| Hydrogen |
0.38
|
| Hydrogen |
0.38
|
Project molecule N2F2
Calculation Data for my Optimised N2F2
| name of submitted log file |
ODAVIES_N2F2_OPTF_POP.LOG
|
| molecule |
N2F2
|
| method |
RB3LYP
|
| basis set |
6-31G(d,p)
|
| final energy |
-309.01241 Hartree
|
| RMS gradient |
0.000000
|
| point group |
C2v
|
Log File: Media: ODAVIES_N2F2_OPTF_POP.LOG
Item Table + Low Frequencies for my Optimised N2F2
Item Table N2F2
         Item               Value     Threshold  Converged?
 Maximum Force            0.000001     0.000015     YES
 RMS     Force            0.000000     0.000010     YES
 Maximum Displacement     0.000001     0.000060     YES
 RMS     Displacement     0.000001     0.000040     YES


Low Frequencies N2F2 (cm⁻¹)

Low frequencies ---    0.0014    0.0022    0.0022    3.2225    4.3532    5.1001
 Low frequencies ---  347.8772  561.2472  771.6105

Both the item table and low frequencies confirm the geometry optimisation of N₂F₂ was successful. The item table monitors Maximum Force and RMS Force (the gradient of energy with respect to nuclear coordinates) and Maximum Displacement and RMS Displacement (how much atomic positions changed in the last optimisation step). Ideally these should all be zero, but due to rounding errors, threshold values are used instead, and all four parameters are below their respective thresholds confirming convergence. The low frequencies list shows the first six frequencies are within ±20 cm⁻¹ of zero, as expected. These near-zero frequencies correspond to the translational and rotational degrees of freedom of the molecule, showing they have no change in potential energy and therefore they also confirm convergence.

Optimised N2F2 Image


Jmol Rotatable N2F2 Image
logfile: Media:ODAVIES_N2F2_OPTF_POP.LOG
Important Geometric Parameters for my Optimised N2F2
Optimised bond distance and angle for N
2F
2
r(F-N)= 1.391Â
r(N=N) = 1.220Â
θ(F-N-N)=114°
θ(F-N-N-F)=0°
The N=N bond length is shorter (1.220 Å) than the N-F bond length (1.391 Å), consistent with it being a double bond as opposed to a single bond. The F-N-N angle of 114° and dihedral angle of 0° confirms the cis planar geometry of the molecule.
Wavenumber, Symmetry, Intensity Table for my Optimised N2F2
| Number |
Vibration (cm⁻¹) |
Symmetry |
Intensities (km/mol)
|
| 1 |
348 |
A1 |
1
|
| 2 |
561 |
A2 |
0
|
| 3 |
772 |
B2 |
75
|
| 4 |
949 |
A1 |
75
|
| 5 |
987 |
B2 |
81
|
| 6 |
1637 |
A1 |
21
|
IR Spectrum for my Optimised N2F2

Question: how many vibrations are expected from the 3N-6 rule?
Answer: N=4 atoms, so 3N-6 = 3(4)-6= 6 vibrations
Why are there only 4 peaks in the IR spectrum?
Answer: Two of 6 modes are extremely weak, mode 1 (348 cm⁻¹, A1, Intensity = 1) and mode 2 (561 cm⁻¹, A2, intensity = 0) are effectively invisible. Mode 2 has zero intensity meaning its IR-inactive and mode 1 is so weak it barely registers, matching the red marker in the spectrum
Question: Which vibration is the asymmetric N-F stretch?
Answer: Mode 5 at 987 cm⁻¹ as its the stronger of the two N-F stretches, the symmetric N-F stretch is at 949 cm⁻¹ (Mode 4). Mode 5 has B2 symmetry which means its antisymmetric with respect to the C
2 rotation and σᵥ mirror plane, meaning the two N-F bonds stretch out of phase with one another, the symmetric N-F stretch is essentially the opposite. Knowing this, asymmetric motion generates larger oscillating dipole moment change than symmetric giving higher IR intensity, and the out-of-phase stretching also results in a slightly higher frequency.
Question: What is the nature of the highest energy vibration?
Answer: This vibration corresponds to the N=N bond stretch, this is because this vibration is completely stretching the bond with the highest force constant (only double bond), stretching of lower force constant bonds or bending of bonds result in weaker energy vibrations. This vibration also has A1 symmetry which indicates symmetry with respect to all symmetry elements of the C
2v point group, and looking at the animation, it is symmetric. A moderate IR intensity (21) also reflects the relatively small dipole moment change upon stretching.
Atomic Charges for my Optimised N2F2

Question: The molecule from the log file does not have bonds between the F and N atoms, what is going on here?
Answer: The N-F bond is longer than the default detection threshold in GaussView, the atoms are still bonding, its just not visible. The N=N bond is shorter and within the detection range so its visible
Atomic charge colour range:

| Atomic charge table
|
| Atom |
Atomic charge (e)
|
| Nitrogen |
0.22
|
| Nitrogen |
0.22
|
| Fluorine |
-0.22
|
| Fluorine |
-0.22
|
The atomic charges show that fluorine carries a partial negative charge (-0.22e) and nitrogen a partial positive charge (+0.22e), which is expected as fluorine is the more electronegative atom and so pulls electron density away from the nitrogen atoms.
MOs for my Optimised N2F2
Question: Which MOs are core orbital MOs?
Answer: MOs 1-4 are the core orbitals as they are derived from the 1s atomic orbitals of each atom, which are low energy and localised close to the nucleus. These orbitals are essentially non-bonding as they do not participate in any significant interaction between atoms
GaussView Image of Molecular Orbital 9 (MO9):

LCAO diagram for MO9:

This LCAO diagram shows how the atomic orbitals of each atom come together to form MO9. The p orbitals on both Nitrogens are in-phase with each other, represented by both the upper lobes being shaded and lower unshaded. The Nitrogens angle towards each other and so the p orbitals overlap sideways above the N=N bond, causing constructive interference due to their in-phase combination. This is a π bonding MO and it contributes to the N=N double bond character. The p orbitals on both Nitrogens are drawn smaller than the p orbitals on the fluorine atoms; this is because the GaussView image of MO9 shows the in-phase combination above the Nitrogens is similar in size to the p orbital lobe above the fluorines, since no combination is occurring at the fluorine atoms, their orbitals must be larger in size.


 Question: how many vibrations are expected from the 3N-6 rule?
Answer: N=4 atoms, so 3N-6 = 3(4)-6= 6 vibrations
Why are there only 4 peaks in the IR spectrum?
Answer: Two of 6 modes are extremely weak, mode 1 (348 cm⁻¹, A1, Intensity = 1) and mode 2 (561 cm⁻¹, A2, intensity = 0) are effectively invisible. Mode 2 has zero intensity meaning its IR-inactive and mode 1 is so weak it barely registers, matching the red marker in the spectrum
Question: Which vibration is the asymmetric N-F stretch?
Answer: Mode 5 at 987 cm⁻¹ as its the stronger of the two N-F stretches, the symmetric N-F stretch is at 949 cm⁻¹ (Mode 4). Mode 5 has B2 symmetry which means its antisymmetric with respect to the C2 rotation and σᵥ mirror plane, meaning the two N-F bonds stretch out of phase with one another, the symmetric N-F stretch is essentially the opposite. Knowing this, asymmetric motion generates larger oscillating dipole moment change than symmetric giving higher IR intensity, and the out-of-phase stretching also results in a slightly higher frequency.
Question: What is the nature of the highest energy vibration?
Answer: This vibration corresponds to the N=N bond stretch, this is because this vibration is completely stretching the bond with the highest force constant (only double bond), stretching of lower force constant bonds or bending of bonds result in weaker energy vibrations. This vibration also has A1 symmetry which indicates symmetry with respect to all symmetry elements of the C2v point group, and looking at the animation, it is symmetric. A moderate IR intensity (21) also reflects the relatively small dipole moment change upon stretching.
Question: how many vibrations are expected from the 3N-6 rule?
Answer: N=4 atoms, so 3N-6 = 3(4)-6= 6 vibrations
Why are there only 4 peaks in the IR spectrum?
Answer: Two of 6 modes are extremely weak, mode 1 (348 cm⁻¹, A1, Intensity = 1) and mode 2 (561 cm⁻¹, A2, intensity = 0) are effectively invisible. Mode 2 has zero intensity meaning its IR-inactive and mode 1 is so weak it barely registers, matching the red marker in the spectrum
Question: Which vibration is the asymmetric N-F stretch?
Answer: Mode 5 at 987 cm⁻¹ as its the stronger of the two N-F stretches, the symmetric N-F stretch is at 949 cm⁻¹ (Mode 4). Mode 5 has B2 symmetry which means its antisymmetric with respect to the C2 rotation and σᵥ mirror plane, meaning the two N-F bonds stretch out of phase with one another, the symmetric N-F stretch is essentially the opposite. Knowing this, asymmetric motion generates larger oscillating dipole moment change than symmetric giving higher IR intensity, and the out-of-phase stretching also results in a slightly higher frequency.
Question: What is the nature of the highest energy vibration?
Answer: This vibration corresponds to the N=N bond stretch, this is because this vibration is completely stretching the bond with the highest force constant (only double bond), stretching of lower force constant bonds or bending of bonds result in weaker energy vibrations. This vibration also has A1 symmetry which indicates symmetry with respect to all symmetry elements of the C2v point group, and looking at the animation, it is symmetric. A moderate IR intensity (21) also reflects the relatively small dipole moment change upon stretching.
 Question: The molecule from the log file does not have bonds between the F and N atoms, what is going on here?
Answer: The N-F bond is longer than the default detection threshold in GaussView, the atoms are still bonding, its just not visible. The N=N bond is shorter and within the detection range so its visible
Atomic charge colour range:
Question: The molecule from the log file does not have bonds between the F and N atoms, what is going on here?
Answer: The N-F bond is longer than the default detection threshold in GaussView, the atoms are still bonding, its just not visible. The N=N bond is shorter and within the detection range so its visible
Atomic charge colour range:

 LCAO diagram for MO9:
 This LCAO diagram shows how the atomic orbitals of each atom come together to form MO9. The p orbitals on both Nitrogens are in-phase with each other, represented by both the upper lobes being shaded and lower unshaded. The Nitrogens angle towards each other and so the p orbitals overlap sideways above the N=N bond, causing constructive interference due to their in-phase combination. This is a π bonding MO and it contributes to the N=N double bond character. The p orbitals on both Nitrogens are drawn smaller than the p orbitals on the fluorine atoms; this is because the GaussView image of MO9 shows the in-phase combination above the Nitrogens is similar in size to the p orbital lobe above the fluorines, since no combination is occurring at the fluorine atoms, their orbitals must be larger in size.