Hamiltisla2
Contents
- 1 Lab1 Marking
- 2 NH3 Molecule
- 3 Project Molecule: N2F2
- 4 BH3 Molecule
- 5 NH3BH3 Molecule
- 6 Me3NH-Cl Molecule
- 7 Ionic liquid pair 1-methyl-imidazolium chloride (HMim-Cl)
- 8 Ionic Liquid Analysis
Lab1 Marking
You have a very good working wiki. It would be good if you report values of wavenumber in your answers. Overall a very good attempt. If you have any specific questions, do email Prof. Hunt
NH3 Molecule
Calculation Data
| Name of submitted log file | hamiltisla_nh3_optf.log |
| Molecule | NH3 |
| Method | RB3LYP |
| Basis set | 6-31G(d,p) |
| Final energy | -56.557769 |
| RMS gradient | 0.000000 |
| Point group | C3v |
Logfile: Media:HAMILTISLA_NH3_OPTF_POP.LOG
Convergence Confirmation
Item Table
         Item               Value     Threshold  Converged?
 Maximum Force            0.000000     0.000015     YES
 RMS     Force            0.000000     0.000010     YES
 Maximum Displacement     0.000003     0.000060     YES
 RMS     Displacement     0.000001     0.000040     YES
Low Frequency Analysis
Confirmation that the stable minimum was reached during optimisation is seen as: -20 < low frequency row 1 < 20
Low frequencies ---   -5.6864   -3.6131   -3.6124    0.0017    0.0048    0.0162
Low frequencies --- 1089.3674 1693.9284 1693.9284
Optimised NH₃ Molecule Image

3D Rotateable NH₃ Molecule
Optimised NH₃ Molecule |
Important Geometric Parameters
Optimised bond distance for NH3
r(N-H)= 1.02Â
Optimised bond angle for NH3
θ(H-N-H)= 106°
Vibrational Analysis
Vibrations Table
| Mode | 1 | 2 | 3 | 4 | 5 | 6 |
| Wavenumber (cm-1) | 1089 | 1694 | 1694 | 3461 | 3590 | 3590 |
| Symmetry | A1 | E | E | A1 | E | E |
| Intensity (arbitrary units) | 145 | 14 | 14 | 1 | 0 | 0 |
IR Spectrum of optimised NH3

Charge Analysis
Charge distribution of Nh3


| Atom | Charge |
| N | -1.13 |
| H | 0.38 |
Project Molecule: N2F2
Calculation Data
| Name of submitted log file | hamiltisla_n2f2_optimisation.log |
| Molecule | N2F2 |
| Method | RB3LYP |
| Basis set | 6-31G(d,p) |
| Final energy | -309.012413 |
| RMS gradient | 0.000000 |
| Point group | C2v |
Logfile: Media:HAMILTISLA N2F2 OPTIMISATION.LOG
Convergence Confirmation
Item Table
         Item               Value     Threshold  Converged?
 Maximum Force            0.000001     0.000015     YES
 RMS     Force            0.000000     0.000010     YES
 Maximum Displacement     0.000001     0.000060     YES
 RMS     Displacement     0.000001     0.000040     YES
Low Frequency Analysis
Confirmation that the stable minimum was reached during optimisation is seen as: -20 < low frequency row 1 < 20
Low frequencies ---    0.0005    0.0005    0.0013    3.2233    4.3533    5.0998
Low frequencies ---  347.8772  561.2472  771.6105
Optimised N2F2 Molecule Image

The molecule from the log file did not have bonds between the F and N atoms due to the bond distance of 1.40Â exceeding the bond distance limit Gauss view will draw bonds for. Thus in the above image the N-F bonds were added using the modify bond tool, and the bond distance was not changed (consistent with the optimised value).
3D Rotateable N2F2 Molecule
Optimised N₂F₂ Molecule |
Important Geometric Parameters
Optimised bond distances for N2F2
r(N-F)= 1.40Â
r(N=N)= 1.22Â
Optimised bond angles for N2F2
θ(F-N-F)= 114°
Dihedral angle θ(F-N=N-F)= 0°
Vibrational Analysis
Vibrations Table
| Mode | 1 | 2 | 3 | 4 | 5 | 6 |
| Wavenumber (cm-1) | 348 | 561 | 772 | 949 | 987 | 1637 |
| Symmetry | A1 | A2 | B2 | A1 | B2 | A1 |
| Intensity (arbitrary units) | 1 | 0 | 75 | 75 | 81 | 21 |
IR spectrum of optimised N2F2

Vibrational Analysis Questions
How many vibrations are expected from the 3N-6 rule?
- N=4, thus from the 3N-6 rule, 3(4)-6=12-6=6, thus 6 vibrational modes are expected. It can be seen that 6 vibrational modes are indeed found.
Why are there only 4 peaks in the IR spectrum?
- Vibrational modes 1 & 2 do not have peaks corresponding to them in the IR spectrum, as they have essentially zero intensity of their vibrational modes due to nearly no net dipole moment. Vibrational modes 3,4,5 and 6 are represented by the 4 peaks in the spectrum.
Which vibration is the asymmetric N-F stretch?
- The vibration that is the asymmetric N-F stretch is mode 3 in the table. Mode 3 has wavenumber 772 cm-1, and intensity 75.
What is the nature of the highest energy vibration?
- The highest energy vibrational mode is mode 6, the N=N bond stretching mode. It has wavenumber 1637 cm-1, and intensity 21.
Charge Analysis
Charge Distribution of N2F2


| Atom | Charge |
| N | 0.22 |
| F | -0.22 |
Molecular Orbital Analysis
Which MOs are core orbital MOs?
- The core MOs are MOs 1, 2, 3, and 4.
Molecular Orbital 9 of N2F2

LCAO of Molecular Orbital 9 of N2F2

Molecular orbital 9 of cis N2F2 is the in phase linear combination of pz orbitals of the N and F atoms
BH3 Molecule
Calculation Data
| Name of submitted log file | hamiltisla_bh3_optimisation.log |
| Molecule | BH3 |
| Method | RB3LYP |
| Basis set | 6-31G(d,p) |
| Final energy | -26.615324 Hartree |
| RMS gradient | 0.000002 |
| Point group | D3h |
Logfile: Media:HAMILTISLA BH3 OPTIMISATION.LOG
Optimisation Confirmation
Item Table
        Item               Value     Threshold  Converged?
 Maximum Force            0.000004     0.000015     YES
 RMS     Force            0.000003     0.000010     YES
 Maximum Displacement     0.000017     0.000060     YES
 RMS     Displacement     0.000011     0.000040     YES
Low Frequency Analysis
Confirmation that the stable minimum was reached during optimisation is seen as: -20 < low frequency row 1 < 20
Low frequencies (cm^-1)---  -12  -12   -7    0    0   0
Low frequencies (cm^-1)--- 1160 1210 1210
Optimised BH3 Molecule image and Jmol
3D Rotatable BH₃ Molecule |
Optimised BH₃ Molecule Image

Important Geometric Parameters
Optimised bond distance for BH3
r(B-H)= 1.19Å
Optimised bond angle for BH3
θ(H-B-H)= 120°
Vibrational Analysis
| Vibrations Table | ||||||
| Mode | 1 | 2 | 3 | 4 | 5 | 6 |
| Wavenumber (cm-1) | 1163 | 1213 | 1213 | 2583 | 2716 | 2716 |
| Symmetry | A2' ' | E' | E' | A1' | E' | E' |
| Intensity (arbitrary units) | 93 | 14 | 14 | 0 | 126 | 126 |
IR Spectrum of optimised BH3

3 peaks are seen in this spectrum consistent with the modes 2 and 3 having identical wavenumber (1213 cm^-1), modes 5 and 6 having identical wavenumber (2716 cm^-1) and mode 1 having wavenumber 1163 cm^-1. Mode 4 has intensity of 0, thus does not show a peak in the IR spectrum.
NH3BH3 Molecule
Calculation Data
| Name of submitted log file | hamiltisla_nh3bh3_optimisation.log |
| Molecule | NH3BH3 |
| Method | RB3LYP |
| Basis set | 6-31G(d,p) |
| Final energy | -83.224689 Hartree |
| RMS gradient | 0.000001 |
| Point group | C1 |
Logfile: Media:HAMILTISLA NH3BH3 OPTIMISATION.LOG
Optimisation Confirmation
Item Table
 Item               Value     Threshold  Converged?
 Maximum Force            0.000001     0.000015     YES
 RMS     Force            0.000001     0.000010     YES
 Maximum Displacement     0.000043     0.000060     YES
 RMS     Displacement     0.000019     0.000040     YES
Low Frequency Analysis
Confirmation that the stable minimum was reached during optimisation is seen as: -20 < low frequency row 1 < 20
Low frequencies (cm^-1)---   -5   -3   0   0   0   1
Low frequencies (cm^-1)---  263  633  638
Optimised NH3 Molecule image and Jmol
3D Rotateable NH₃BH₃ Molecule |
Optimised NH₃BH₃ Molecule Image

Important Geometric Parameters
Optimised bond distance for NH3BH3
r(N-B)= 1.67Å
r(B-H)= 1.21Å
r(N-H)= 1.02Å
Optimised bond angle for NH3BH3
θ(H-B-H)= 114°
θ(H-N-H)= 108°
θ(H-B-N)= 105°
θ(H-N-B)= 111°
Vibrational Analysis
| Vibrations Table | ||||||||||||||||||
| Mode | 1 | 2 | 3 | 4 | 5 | 6 | 7 | 8 | 9 | 10 | 11 | 12 | 13 | 14 | 15 | 16 | 17 | 18 |
| Wavenumber (cm-1) | 263 | 633 | 638 | 638 | 1069 | 1069 | 1196 | 1204 | 1204 | 1329 | 1676 | 1676 | 2472 | 2532 | 2532 | 3464 | 3581 | 3581 |
| Symmetry | A | A | A | A | A | A | A | A | A | A | A | A | A | A | A | A | A | A |
| Intensity (arbitrary units) | 0 | 14 | 4 | 4 | 41 | 41 | 109 | 3 | 3 | 114 | 28 | 28 | 67 | 231 | 231 | 3 | 28 | 28 |
IR Spectrum of optimised NH3BH3

8 peaks are seen in the IR spectrum of NH3BH3, consistent with modes 1, 3, 4, 8, 9, and 16 having intensities too low to be seen on the spectrum. The peaks correspond to mode 2 (633 cm^-1), modes 5 and 6 (1069 cm^-1), mode 7 (1196 cm^-1), mode 10 (1329 cm^-1), modes 11 and 12 (1676 cm^-1), mode 13 (2472 cm^-1), modes 14 and 15 (2532 cm^-1), and modes 17 and 18 (3581 cm^-1).
Association Energy
E(NH3)= -56.557769 au
E(BH3)= -26.615324 au
E(NH3BH3)= -83.224689 au
Association Energy:
ΔE = E(NH3BH3) - [E(NH3) + E(BH3)]
=> ΔE= -83.224689 - [ -56.557769 - 26.615324] = -0.0516 au (3sf)
=> ΔE= -136 kJ/mol
This association energy shows the stabilisation that occurs when NH3 and BH3 form the adduct NH3BH3. The negative value of ΔE (−136 kJ/mol) indicates that formation of the adduct is energetically favourable relative to the separated fragments, meaning the bonded system is more stable than NH3 and BH3 alone.
Me3NH-Cl Molecule
Calculation Data
| Name of submitted log file | hamiltisla_Me3NHCl_optimisation.log |
| Molecule | Me3NH-Cl |
| Method | RB3LYP |
| Basis set | 3-21G |
| Final energy | -632.162083 Hartree |
| RMS gradient | 0.000016 |
| Point group | C1 |
Logfile: Media:HAMILTISLA ME3NHCL OPTIMISATION.LOG
Optimisation Confirmation
Frequency Item Table
          Item               Value     Threshold  Converged?
 Maximum Force            0.000043     0.000450     YES
 RMS     Force            0.000010     0.000300     YES
 Maximum Displacement     0.001476     0.001800     YES
 RMS     Displacement     0.000355     0.001200     YES
Low Frequency Analysis
Confirmation that the stable minimum was reached during optimisation is seen as: -10 < low frequency row 1 < 10
Low frequencies (cm^-1)---   -5   0    0    0   3   9
Low frequencies (cm^-1)---   55  57  190
Optimised Me₃NH-Cl Molecule image and Jmol
3D Rotateable Me₃NH-Cl Molecule |
Optimised Me₃NH-Cl Molecule Image

Optimised bond distances for Me3NH-Cl
r(N-H)= 1.16Å
r(H-Cl)= 1.74Å
r(N-Cl)= 2.90Å
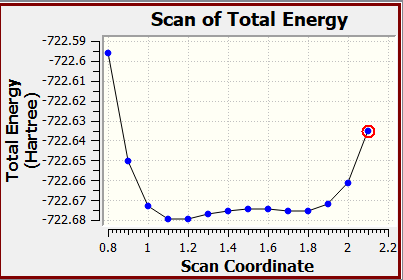
Scan of Total Energy
Rigid Scan log file: File:HAMILTISLA ME3NHCL RIGIDSCAN THURS7.LOG
Processed PES plot of Me₃NH-Cl

The scanned coordinate corresponds to the N–H bond length, starting at 0.8 Å and increasing in 0.1 Å increments up to 2.1 Å. This tracks the gradual shift of the proton between the ionic ion-pair (Me3NH+ - - Cl-) and a neutralised form (Me3N - - HCl). The PES shows that, for the scan with N–Cl distance fixed at 3.2 Å, the most stable configuration corresponds to the ion-pair form (Me3NH+ - - Cl-), with a clear energy minimum in this region.
At longer N–H distances, a broad shelf is observed rather than a distinct second minimum, indicating that proton transfer towards a neutral Me3N - - HCl pair is not energetically favoured. As the proton is moved towards chloride, the energy increases smoothly, consistent with a gradual loss of stabilising ion-pair interactions rather than formation of a different stable structure.
Raw PES data table
| Scan Coordinate (Å) | Total Energy (Hartree) | Relative Total Energy (kJ/mol) |
| 0.8 | -632.0662556 | 229.9 |
| 0.9 | -632.122424 | 82.4 |
| 1.0 | -632.1460522 | 20.4 |
| 1.1 | -632.1535102 | 0.8 |
| 1.2 | -632.1538035 | 0 |
| 1.3 | -632.1515778 | 5.8 |
| 1.4 | -632.1490207 | 12.6 |
| 1.5 | -632.1470189 | 17.8 |
| 1.6 | -632.1457428 | 21.2 |
| 1.7 | -632.1447861 | 23.7 |
| 1.8 | -632.1429362 | 28.5 |
| 1.9 | -632.1375943 | 42.6 |
| 2.0 | -632.1238571 | 78.6 |
| 2.1 | -632.093225 | 159.0 |
Ionic liquid pair 1-methyl-imidazolium chloride (HMim-Cl)
Molecule a)
Log File: File:IH IONPAIR A OPTIMISATION.LOG
Calculation Data
| Name of submitted log file | IH_ionpair_a_optimisation.log |
| Molecule | HMim-Cl |
| Method | RB3LYP |
| Basis set | 3-21G |
| Final energy | -722.687898 |
| RMS gradient | 0.000028 |
| Point group | C1 |
Frequency Item table
  Item               Value     Threshold  Converged?
 Maximum Force            0.000053     0.000450     YES
 RMS     Force            0.000018     0.000300     YES
 Maximum Displacement     0.001533     0.001800     YES
 RMS     Displacement     0.000443     0.001200     YES
Low Frequency analysis
Confirmation that the stable minimum was reached during optimisation is seen as: -10 < low frequency row 1 < 10
Low frequencies (cm^-1)---   -4   -1   0   0    0    3
Low frequencies (cm^-1)---   36   64   80
Important Geometric Parameters
Atom relevant to bond is indicated by number 1-14 in labeled diagram below
[7-14] r(H-Cl) = 1.72Å;
[9-7] r(N-H) = 1.18Å
[1-4] r(C-H) = 1.0 MISSING DECIMAL PLACE Å
[3-6] r(C-H) = 1.07Å

HMim-Cl Molecule a Energy Scan
N-H Rigid scan of molecule a log file: File:IH IONPAIR A RIGIDSCAN THURS7.LOG
Gaussview raw Potential Energy Surface plot of HMim-Cl molecule a

Processed Potential Energy Surface of HMim-Cl molecule a) rigid scan

This rigid scan shows how the energy of HMim–Cl changes as the N–H distance is varied from 0.8Å to 2.1Å, while the N–Cl distance is fixed at 3.2Å. The lowest energy occurs at 1.1Å, which corresponds to the most stable N–H - - Cl interaction is the equilibrium for the ion pair along this coordinate.
At shorter distances (<1.0Å), the energy rises steeply due to strong repulsion between the nuclei as they are forced too close together. At longer distances (>1.2Å), the energy increases more gradually as the N–H - - Cl interaction weakens and the system moves towards dissociation.
Raw Data of rigid energy scan of HMim-Cl Molecule a
| Scan Coordinate (Å) | Total Energy (Hartree) | Relative Total Energy (kJ/mol) |
| 0.8 | -722.595816 | 219.4 |
| 0.9 | -722.6504012 | 76.1 |
| 1.0 | -722.6727673 | 17.3 |
| 1.1 | -722.6793742 | 0 |
| 1.2 | -722.6792901 | 0.2 |
| 1.3 | -722.6772109 | 5.7 |
| 1.4 | -722.675321 | 10.6 |
| 1.5 | -722.6744387 | 13.0 |
| 1.6 | -722.6746233 | 12.5 |
| 1.7 | -722.6753492 | 10.6 |
| 1.8 | -722.6753453 | 10.6 |
| 1.9 | -722.672138 | 19.0 |
| 2.0 | -722.6613138 | 47.4 |
| 2.1 | -722.6354852 | 115.2 |
Molecule b)
Log File: File:IH IONPAIR B OPTIMISATION.LOG
Calculation Data
| Name of submitted log file | IH_ionpair_b_optimisation.log |
| Molecule | HMim-Cl |
| Method | RB3LYP |
| Basis set | 3-21G |
| Final energy | -722.666200 Hartree |
| RMS gradient | 0.000018 |
| Point group | C1 |
Frequency Item table
 Item               Value     Threshold  Converged?
 Maximum Force            0.000192     0.000450     YES
 RMS     Force            0.000040     0.000300     YES
 Maximum Displacement     0.001419     0.001800     YES
 RMS     Displacement     0.000215     0.001200     YES
Low Frequency analysis
Confirmation that the stable minimum was reached during optimisation is seen as: -10 < low frequency row 1 < 10
Low frequencies (cm^-1)---   -6   -4   -2   0   0   0
Low frequencies (cm^-1)---   45  162  199
Important Geometric Parameters
Atom relevant to bond is indicated by number 1-14 in labeled diagram below
[4-15] r(H-Cl) = 2.13Å
[12-14] r(H-Cl) = 2.28Å
[2-5] r(C-H) = 1.10Å
[10-12] r(C-H) = 1.11Å

Molecule c)
Log File: File:IH IONPAIR C OPTIMISATION.LOG
Calculation Data
| Name of submitted log file | IH_ionpair_c_optimisation.log |
| Molecule | HMim-Cl |
| Method | RB3LYP |
| Basis set | 3-21G |
| Final energy | -761.779525 |
| RMS gradient | 0.000014 |
| Point group | C1 |
Frequency Item table
  Item               Value     Threshold  Converged?
 Maximum Force            0.000050     0.000450     YES
 RMS     Force            0.000009     0.000300     YES
 Maximum Displacement     0.001308     0.001800     YES
 RMS     Displacement     0.000306     0.001200     YES
Low Frequency analysis
Confirmation that the stable minimum was reached during optimisation is seen as: -10 < low frequency row 1 < 10
Low frequencies (cm^-1)---   -4   -3   0   0   0    2
Low frequencies (cm^-1)---   52  103  107
Important Geometric Parameters
Atom relevant to bond is indicated by number 1-17 in labeled diagram below
[4-17] r(H-Cl) = 2.03Å
[16-17] r(H-Cl) = 2.42Å
[1-4] r(C-H) = 1.12Å
[13-16] r(C-H) = 1.10Å
[3-5] r(C-H) = 1.07Å
[9-12] r(C-H) = 1.09Å

Ionic Liquid Analysis
Bond Length Comparison Table
| Ion Pair Molecule | H-Cl bond length (Å) | H-Cl bond length additional (Å) |
| HMim-Cl a | 1.72 | |
| HMim-Cl b | 2.13 [Cis alkene H to Cl] | 2.28 [Methyl H to Cl] |
| HMim-Cl c | 2.03 | |
| Me3NH-Cl | 1.74 |
How do the H-Cl bonds of Me3NH and HMim compare and how do the H-bonds of the N-H and C-H H-bonds compare?
- The H-Cl bonding in both Me3NH–Cl [1.74 Å] and HMim–Cl molecule a [1.72 Å] is quite strong, with very similar H-Cl distances (Difference of 0.02 Å). In both of these cases the proton involved is attached to a nitrogen, producing a highly polarised N–H bond that strongly attracts the chloride. The other HMim–Cl molecules, b and c, show longer H-Cl distances than those of molecule a and Me3NH–Cl. Molecule b has a 2.13 Å bond from its cis alkene proton to the chloride and a 2.28 Å bond from the methyl protons to the chloride. Molecule c has a 2.03 Å bond from its CH proton to the chloride. These longer distances correspond to weaker hydrogen bonding interactions in the molecules. In structures b and c the chloride interacts with C-H protons rather than N-H protons. Since C–H bonds are less polarised than N–H bonds due to the greater electronegativity difference for N-H bonds than C-H bonds, the hydrogen atoms carry a smaller partial positive charge in C-H bonds and therefore form weaker hydrogen bonds with chloride.
Are these distances representative of a H-bond?
- Van der Waals radius of Cl = 1.75 Å
- Van der Waals radius of H = 1.20 Å
- Sum of the Van der Waals radii of H and Cl = 1.75 + 1.20 = 2.95 Å
- All the observed H-Cl distances for the studied ion pairs are shorter than 2.95 Å. Distances shorter than the sum of the van der Waals radii indicates attractive interactions that are stronger than simple intermolecular interactions thus this consistent with the hydrogen bonding seen in the studied ion pairs. The much shorter distances for Me3NH–Cl [1.21 Å shorter] and HMim–Cl molecule a [1.73 Å shorter] are consistent with partially ionic hydrogen bonds.
Will the ionic nature of the ions effect a distance based assessment of H-bonding?
- Yes the ionic nature of the ions will effect a bond distance based assessment. In the ion pairs the positive and negative ions attract each other, which can shorten the H-Cl bond distance. This implies that bond distance alone shouldn't be used to assess the strength of the H-bonding.
Association Energy Comparison of HMim–Cl isomers
Molecule a and b cation HMim+
Cation cluster of a and b are the same, therefore using the same optimisation of HMim+ in 3-21G basis set:
Log file: File:IH A B CATION CLUSTER OPTIMISATIN.LOG
Optimised HMim+ Molecule a and b cation |
Calculation Table
| Name of submitted log file | IH_a_b_cation_cluster_optimisation.log |
| Molecule | Hmim+ |
| Method | UB3LYP |
| Basis set | 3-21G |
| Final energy | -264.589131 au |
| RMS gradient | 0.000011 |
| Point group | C1 |
Frequency Item Table
  Item               Value     Threshold  Converged?
 Maximum Force            0.000030     0.000450     YES
 RMS     Force            0.000006     0.000300     YES
 Maximum Displacement     0.001212     0.001800     YES
 RMS     Displacement     0.000357     0.001200     YES
Low Frequency Analyis
Low frequencies ---   -5   -4   0   0   0    4
Low frequencies ---   91  155  336
Molecule 3 cation cluster Hmim+ with extra methyl
Log file: File:IH A B CATION CLUSTER OPTIMISATIN.LOG
Optimised HMim+ Molecule c cation |
Calculation Table
| Name of submitted log file | IH_c_cation_optimisation.log |
| Molecule | Hmim+ |
| Method | UB3LYP |
| Basis set | 3-21G |
| Final energy | -303.687395 au |
| RMS gradient | 0.000006 |
| Point group | C1 |
Frequency Item Table
  Item               Value     Threshold  Converged?
 Maximum Force            0.000014     0.000450     YES
 RMS     Force            0.000003     0.000300     YES
 Maximum Displacement     0.000247     0.001800     YES
 RMS     Displacement     0.000076     0.001200     YES
Low Frequency Analysis
Low frequencies ---   -4   0    0    0   3   4
Low frequencies ---   83   98  147
Chlorine anion optimisation
Logfile: File:IH CHLORINE ANION OPTIMISATION.LOG
| Name of submitted log file | IH CHLORINE ANION OPTIMISATION.LOG |
| Molecule | Cl- |
| Method | UB3LYP |
| Basis set | 3-21G |
| Final energy | -457.945733 au |
| RMS gradient | 0.000000 |
| Point group | C1 |
Frequency Item Table
 Item               Value     Threshold  Converged?
 Maximum Force            0.000000     0.000450     YES
 RMS     Force            0.000000     0.000300     YES
 Maximum Displacement     0.000000     0.001800     YES
 RMS     Displacement     0.000000     0.001200     YES
Frequency Analysis table
Low frequencies --- 0 0 0
Optimised HMim+ Molecule c cation |
Association Energy Table ΔE = E(Products) - [E(Reactants)] = E(Ion pair) - [E(Cation) + E(Anion)]
| HMim–Cl isomer | Total Energy (au) | Association Energy ΔE (au) | Association Energy ΔE (kJ/mol) |
| a) | -722.687898 | -0.153034 | -402 |
| b) | -722.666200 | -0.131336 | -345 |
| c) | -761.779525 | -0.146397 | -384 |
Relative Energy between HMim–Cl isomers a) and b)
- ΔE = Eb - Ea = (-722.666200) - (-722.687898) = 0.021698 au or 56.97 kJ/mol (4sf)
- Therefore, isomer b is 57 kJ/mol higher in energy than isomer a.
- This indicates that isomer a is more stable and lower in energy than isomer b. This is consistent with isomer a forming a strong N–H-Cl hydrogen bond with a short H-Cl distance of 1.72 Å. The N–H bond is highly polarised, so the hydrogen carries a partial positive charge and interacts strongly with the chloride anion. In comparison isomer b forms weaker C–H-Cl interactions with longer H-Cl distances of 2.13 Å and 2.28 Å. The C–H bonds in b are less polarised than the N–H bond in a, resulting in weaker electrostatic attraction to chloride and therefore less stabilisation. As a result, isomer b is higher in energy than isomer a.
Discuss the dissociation energy of (c) relative to (a) and (b). What does the comparison tell us about the H-bonding?
Chemical diagram of the two protonation states for HMim-Cl

HMim-Cl and Me3NH-Cl PES Comparison
MeNH-Cl and HMim-Cl PES plot

Both the HMim–Cl and Me3NH–Cl PES plots show a clear minimum around 1.1–1.2 Å, which corresponds to the lowest energy and therefore most stable N–H-Cl hydrogen bond interaction. In both cases, the energy rises sharply at distances shorter than 1.1 Å due to strong repulsion when the nuclei are forced too close together, and increases more gradually at distances longer than 1.2 Å as the N–H interaction with chloride is reduced and the system moves towards dissociation.
The overall shapes of the two curves are very similar, but HMim–Cl shows a slightly deeper and broader minimum compared to Me3NH–Cl. This suggests that HMim–Cl is more stabilised and less sensitive to small changes in N–H distance near the scan coordinate equilibrium than Me3NH-Cl. This difference is also reflected at the extremes of the scan. Me3NH–Cl is higher in energy at both short (0.8 Å) and long (2.1 Å) N–H distances, and its energy increases more steeply after 1.2 Å, indicating a less stabilised interaction when the hydrogen bond is stretched.
One possible reason for these differences in the PES of the ion pairs is the difference in electronic structure of their respective cations. In HMim-Cl, the positive charge is delocalised over the imidazolium ring, which may increase the polarisation of the N–H bond compared to the more localised charge in Me3NH–Cl. This may leads to HMin-Cl having a stronger interaction with chloride than Me3NH-Cl.