Hayalex1
Jump to navigation
Jump to search
Contents
NH3
Calculation Data
Optimisation of NH3 was performed using the following parameters:
| Log file | AH_opf_pop.log |
| Molecule | NH3 |
| Method | RB3LYP |
| Basis set | 6-31G(d,p) |
| Final energy | -56.55777 au |
| RMS gradient | 0.000000 |
| Point group | C3V |
Convergence data
The following data was collected from the log file, confirming convergence.
Item table
         Item               Value     Threshold  Converged?
 Maximum Force            0.000000     0.000015     YES
 RMS     Force            0.000000     0.000010     YES
 Maximum Displacement     0.000003     0.000060     YES
 RMS     Displacement     0.000001     0.000040     YES
Low frequencies
 Low frequencies ---   -5.6864   -3.6131   -3.6124    0.0017    0.0048    0.0162
 Low frequencies --- 1089.3674 1693.9284 1693.9284
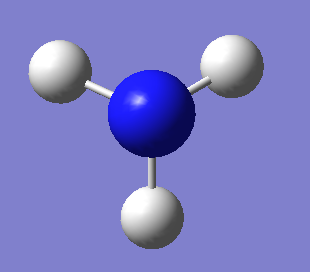
Optimised molecule
Molecule parameters
- r(N-H): 1.02Â
- θ(H-N-H): 106°
Molecular structure

NH₃ top-down view
NH₃ 3D view |
Vibrational analysis and IR spectrum
| Mode | 1 | 2 | 3 | 4 | 5 | 6 |
| Wavenumber (cm-1) | 1089 | 1694 | 1694 | 3461 | 3590 | 3590 |
| Symmetry | A1 | E | E | A1 | E | E |
| Intensity | 145 | 14 | 14 | 1 | 0 | 0 |

Charge distribution
| Atom | N | H |
| Charge (e) | -1.13 | +0.38 |


Log file
cis-N2F2 (Project molecule)
Calculation Data
Optimisation of N2F2 was performed using the following parameters:
| Log file | AH_N2F2_OPTF_POP.LOG |
| Molecule | N2F2 |
| Method | RB3LYP |
| Basis set | 6-31G(d,p) |
| Final energy | -309.01241 au |
| RMS gradient | 0.000000 |
| Point group | C2V |
Convergence data
The following data was collected from the log file, confirming convergence.
Item table
         Item               Value     Threshold  Converged?
 Maximum Force            0.000001     0.000015     YES
 RMS     Force            0.000000     0.000010     YES
 Maximum Displacement     0.000001     0.000060     YES
 RMS     Displacement     0.000001     0.000040     YES
Low frequencies
 Low frequencies ---    0.0014    0.0022    0.0022    3.2225    4.3532    5.1001
 Low frequencies ---  347.8772  561.2472  771.6105
Optimised molecule
Molecule parameters
- r(N-F): 1.39Â
- r(N=N): 1.22Â
- θ(F-N=N): 114°
- θ(F-N=N-F): 0°
Molecular structure

N₂F₂ 3D view |
Vibrational analysis and IR spectrum
Data
| Mode | 1 | 2 | 3 | 4 | 5 | 6 |
| Wavenumber (cm-1) | 348 | 561 | 772 | 949 | 987 | 1637 |
| Symmetry | A1 | A2 | B2 | A1 | B2 | A1 |
| Intensity | 1 | 0 | 75 | 75 | 81 | 21 |

- The 3N-6 rule gives us an expected 6 vibrations (3 × 4 - 6 = 6).
- There are only 4 peaks on the IR spectrum because two of the vibrational modes have negligible change in dipole moment, so they are not visible.
- Vibrational mode 3 represents the asymmetric N-F stretching vibration.
- The highest energy mode is the N=N stretching vibration.
Charge distribution
cis-N2F2 has a charge separation driven by the high electronegativity of the fluorine atoms.
| Atom | N | F |
| Charge (e) | +0.22 | -0.22 |


Molecular orbital analysis
- MOs 1-4 correspond to the core orbitals of the atoms.
Molecular Orbital 9
The 9th molecular orbital of cis-N2F2 can be represented as the in-phase addition of the pz orbitals on the N and F atoms.


